ElectricityMap - The Product Vision
ElectricityMap
According to the US National Oceanic and Atmospheric Administration, 2020 was Earth’s 2nd hottest year ever recorded, just behind 2016. It was also Earth’s 44th year with global land and ocean temperatures, at least nominally, above 20th century average1. A major cause of global warming is the greenhouse effect, where human activities (particularly burning fossil fuels to generate energy) are increasing the concentrations of greenhouse gases in the atmosphere2. Since the Paris Agreement was signed in 2015, many countries have planned clean energy initiatives in the near future345. However, more than 50% of the worlds' electricity is still generated by burning fossil fuels6.
Beside the involvement of goverments and energy suppliers, the role of the individual can also have an influence on this problem. The current state of this issue and the progress we’ve made is often missed or ignored by the general public. People don’t know how “clean” their electricity is and where it comes from. With this in mind, ElectricityMap was created: an interactive visualization tool that shows how a country generates and consumes electricity.
What is ElectricityMap?
ElectricityMap is a visualization of electricity consumption and production across the world. The project tries to track live energy consumption and production. Based on this data, the carbon footprint of each region is calculated. Furthermore, it dissects the 24h live energy data into specific categories (for example nuclear, biomass, wind, solar, etc.) and records electricity import and export if possible. Currently, their data covers around 110 regions across the world. The project can be viewed on their website or can be downloaded as an Android app or as an iOS app.
The project is currently open-sourced on GitHub and is being maintained by the employees of Tomorrow Co and a community of developers. Their goal is to raise awareness on global electricity consumption and production and to help people understand and reduce their carbon footprint. In subsequent sections you can read more about ElectricityMap’s domain concepts, stakeholders, quality attributes, and roadmap.
ElectricityMap System
System’s key capabilities
ElectricityMap provides an interactive visualization of electricity use across the globe. It is an open-source platform that can be accessed by anyone from students to world leaders. It helps people to understand the climate impact of global electricity use more easily.7 The visualization itself is built with d3.js and mapbox GL. The users can view the global usage from the map, to access the details of each area, the user can either type in the area name on the top left search box, or the user can manually click on the specific area on the map. It will provide the users the detailed information such as electricity production/consumption by different sources, carbon intensity in the last 24 hours, electricity prices in the last 24 hours, etc.
System Use Cases
The ElectrictyMap system has different capabilities. The employees of Tomorrow Co are the people who are in charge of maintaining and developing most features for ElectricityMap. Then there are the community users who view the project and can get a deeper understanding of carbon footprint with the help of Electricity map, they also report bugs or suggest new ideas for the development of the project to the contributors. However, if someone wants to contribute to the project, they can join the community on GitHub. Since they’re not employees of Tomorrow Co., they are considered open-source contributors to the project. They usually work on smaller issues and their contribution is reviewed by the employees of Tomorrow Co before being added to the project.
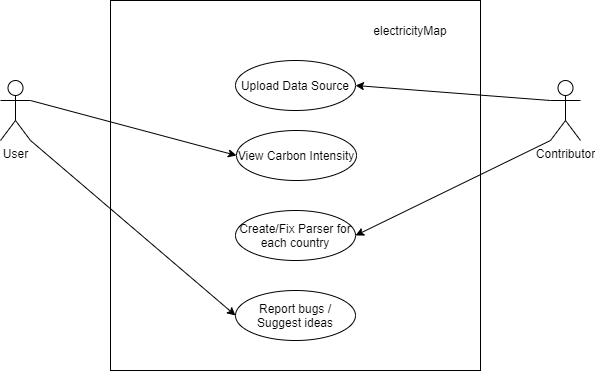
Figure: ElectricityMap Use Case Diagram
Stakeholders
According to Rozanski and Woods8, “A stakeholder in the architecture of a system is an individual, team, organisation, or classes thereof, having an interest in the realisation of the system.” An open source project (such as ElectricityMap) may not always adhere to such clear cut definitions of a stakeholder, unlike more traditional corporations. That being said, it does have some associated with it.
The following is a list of major stakeholder areas (relevant to our use case) taken from “Lean Architecture for Agile Software Development” by Jim Coplien and Gertrud Bjørnvig9:
-
The developers - Being an open source project, ElectricityMap has hundreds of contributors (i.e., developers) listed on GitHub. Some of the more notable ones include Olivier Corradi, founder of Tomorrow, and Trevor Hinkle, head of the ElectricityMap project.
-
The business - Tomorrow is a startup founded in Copenhagen, Denmark and is the parent company of ElectricityMap. The project was started by the founder Olivier Corradi and is currently spearheaded by Trevor Hinkle. This of course makes Tomorrow the key corporate stakeholder of ElectricityMap. Additionally, the GitHub page also lists dependencies on open source projects spearheaded by corporations such as React Native by Facebook10, serialize-javascript by Yahoo!11, and javascript by AirBnb12, making them stakeholders as well.
-
The customers - In the case of ElectricityMap, the customers aren’t those who pay for it, since it is freely available to use for anyone who wants to do so. Rather, “customers” in this context would refer to those who use the information generated by this project to make more conscious decisions to lower their carbon footprint. This includes both people and corporations.
Roadmap
ElectricityMap is created by Tomorrow, a Danish company that aims to “power [the transition to a low-carbon future] by getting the world to understand and reduce their carbon footprint."13 Although the project itself does not have a roadmap, it is indirectly stated that their goal is to obtain as much current and historical data regarding CO2 emissions in as many countries as they possibly can. In their blog14, Tomorrow claims a need for a platform that allows “all organizations [to] get their carbon footprint calculated automatically at an approachable cost.” They continue to posit the thesis that competition in the marketplace for reducing carbon footprints would be driven largely by customer sentiment and tax incentives make sustainable activities more profitable.
A platform that quantifies environmental externalities, they argue, serves a common good while also providing regulators with high-quality information. The closest discernable thing to a roadmap are the following three points, which Tomorrow argues are necessities for such a transformation to occur (taken from their blog14):
- Automation. Footprint assessment won’t be democratised if it remains people-intensive and spreadsheet-based. Activities happening in organisations are already heavily digitalised. For example, information about electricity consumption is available through smart-meters, and information about employee travel is available in accounting systems. Why don’t we use this data to automate the footprint assessment?
- Actionability. Having a yearly report is insufficient. In order to help organisations understand opportunities for reduction and track their progress, footprint tracking must be closer to real-time. Breaking down total emissions in a few categories is also insufficient: In order to discover reduction opportunities, the insights must be granular enough, closer to individual activities.
- Openness. Different accounting methodologies lead to inconsistent assessments. For example, it is possible for a company to claim to be 100% renewable and still physically rely on fossil fuels. Open sourcing carbon models enable actors around the world to trust the system due to its transparency. Furthermore, it enables experts to contribute around carbon models, thus creating a common good that will be far superior in precision and quality than what a single actor could create. Being a common good, it would allow anyone to verify the models in use, improve them, and re-use them in other products.
Ethical Considerations
The ethical considerations of the platform are plainly visible, as Tomorrow aims to inform and transform the world by providing high-quality data about carbon footprints, and tools to combat and minimize such footprints. Not only do they encourage companies to evaluate their own footprints, they also are developing a product called Bloom that allows individuals to calculate their footprints15.
Tomorrow also emphasizes user privacy by preventing the data from leaving the user’s device by performing the computations locally16. While good for user privacy, a major implication of this is the energy consumed by performing local computations could have microscopic environmental impacts, particularly if the device is battery-powered (leads to faster wear on the battery over time). On the other hand, if the device is not battery-powered, it still has ethical implications if these machines performing local computations are powered by non-renewable energy - meaning they’re attempting to fight climate change using polluting energy sources. Some advanced machine learning models consume enormous amounts of energy, which leads to further pollution should the machines not be powered renewably.
References
-
NOOA. news. Retrieved 28 Feb, 2021, from https://www.noaa.gov/news/2020-was-earth-s-2nd-hottest-year-just-behind-2016#:~:text=2020%20as%20ranked%20by%20other,sharing%20the%20first%2Dplace%20spot. ↩︎
-
Australian DAWE. Retrieved 28 Feb, 2021, from https://www.environment.gov.au/climate-change/climate-science-data/climate-science/greenhouse-effect#:~:text=The%20greenhouse%20effect%20is%20a,re%2Dradiated%20by%20greenhouse%20gases.&text=The%20absorbed%20energy%20warms%20the%20atmosphere%20and%20the%20surface%20of%20the%20Earth. ↩︎
-
Dutch RIVM. Retrieved 28 Feb, 2021, from https://www.rivm.nl/onderwerpen/energietransitie ↩︎
-
Chinese Goverment news. Retrieved 28 Feb, 2021, from http://www.gov.cn/xinwen/2018-11/27/content_5343609.htm?_zbs_baidu_bk ↩︎
-
EU action. Retrieved 28 Feb, 2021, from https://ec.europa.eu/clima/policies/international/negotiations/paris_en ↩︎
-
World Energy Balances: Overview. Retrieved 28 Feb, 2021, from https://www.iea.org/reports/world-energy-balances-overview ↩︎
-
ElectricityMap OpenSource Retrieved 3 Mar, 2021 https://api.electricitymap.org/open-source/ ↩︎
-
Stakeholders, from Software Systems Architecture by Nick Rozanski and Eoin Woods ↩︎
-
Stakeholder Engagement, from “Lean Architecture for Agile Software Development” by Jim Coplien and Gertrud Bjørnvig ↩︎
-
Tomorrow. Retrieved 3 Mar, 2021, from https://www.tmrow.com/ ↩︎
-
Scalable Climate Change Solutions. Retrieved 3 Mar, 2021, from https://www.tmrow.com/blog/scalable-solutions-to-climate-change/ ↩︎
-
Bloom. Retrieved 3 Mar, 2021, from https://bloomclimate.com/ ↩︎
-
Opening Keynote RSC 2019. Retrieved 3 Mar, 2021, from https://www.youtube.com/watch?v=UR3K4CokeHA ↩︎