ElectricityMap
We have explained the product vision in our previous blogpost. In this essay we will cover the software architecture of ElectricityMap, its' architectural views and design principles.
Architectural Style
It was quite a task trying to identify the underlying architecture of electricitymap. Neither the documentation on the GitHub page nor the website really state an explicit architecture on which electricitymap was built. After some time we reached out to the developers on the Slack channel and they confirmed that our conclusion was correct. There isn’t one focused or specific underlying/unifiying architecture for this project.
There are, however, some takeaways. The project consists of parsers (written in Python) for individual countries and/or regions. For example, the US is divided into regional power grids whereas India has a parser for individual states1. Each parser is a self-contained module that the backend will run periodically. This makes it a lot easier for contributors because they don’t have to think about dependencies throughout the project. The raw data from the parsers are then stored in the database until they are picked up by the data pipeline. The data pipeline will then run some computational algorithms calculating different values such carbon intensity, consumption mix, renewablePercentage, and more. This data is then stored in a state object in a redis cache which can be accessed by the frontend through the API. However, the API is closed source and the redis cache is behind the API, as told to us by the developers. So for the open source portion on GitHub, the project uses a mockserver.
Container View
According to the C4 model “A container is something that needs to be running in order for the overall software system to work.2” In real world terms, this would include the following:
- Database - Redis is more of a key-value store than a traditional database, but for the purposes of the electricitymap use case it does act as a database. As noted in the previous section, electricitymap uses a mockserver for the open sourced front end, since the redis cache is located behind the API which is closed source.
- Mobile application - Electricitymap has both Android and iOS apps available for download.
- Client-side web app - The live map is accessed through a web browser on the client side (rendered using JavaScript).
- Docker - Used for containerizing the application. The docker image has to be built in order to view the live map on a web browser
- Poetry - Used to manage and install dependencies of Python projects, including electricitymap.
The C4 model lists other containers that are not applicable to electricitymap such as shell scripts, file systems, blob or content stores, etc.
Component and Connector View
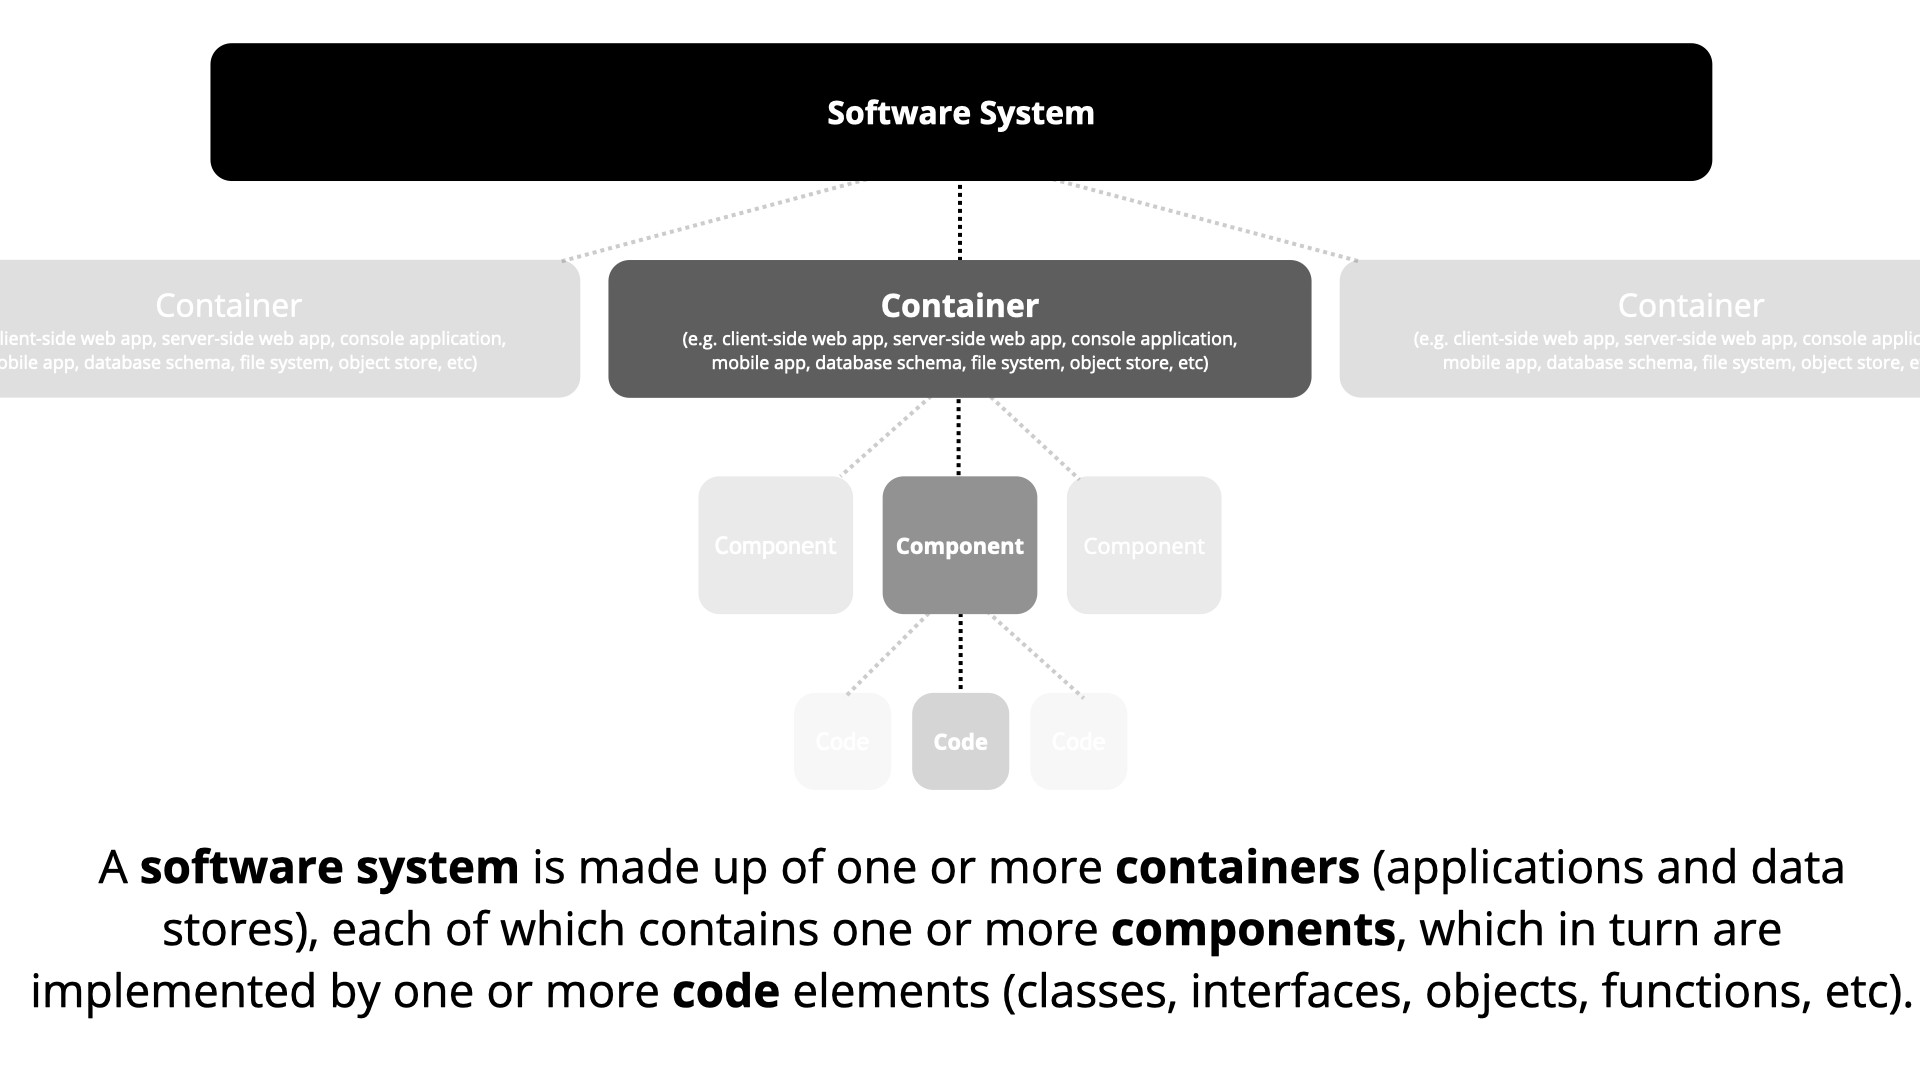
The software system is consisted of one or more containers, such as frontend web applications, backend web applications, mobile apps, databases, etc, each of container is made up of one or more components, which are groupings of related functionality encapsulated behind a well defined interface. 2
According to the C4 model (Context, Containers, Components, and Code) for visualizing software architecutre, The relation of different levels can be shown below, the Component view is a mid level view, which are just one level above the code view.
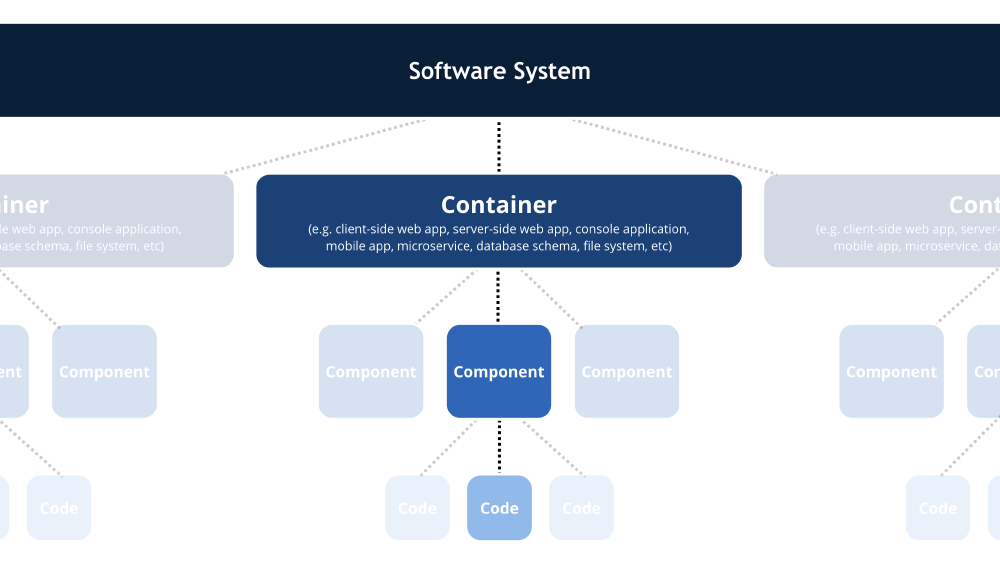
Figure: Abstractions for C4 model
Since ElectricityMap is a web-based project, the project is structured in such a way that the front-end and back-end are separated. Below we can take a look at what each module does and how they relate to each other:
- config: This component provides data points used in the web application. For example, bounding boxes for regions in the world.
- parsers: this module contains all available webscrapers used to obtain useful information. The live energy data is gathered in this module.
- parsers/tests: This module contains tests for parsers and configs
- web: this module creates a web interface for data extracted with the parsers. Users will interact with the functionalities implemented here.
- mockserver: this module mocks the existing data storage server. This module mainly serves as a testground for web module.
- mobileapp: this module contains necessary files to make ElectricityMap also compatible on Android and IOS devices.
We have made a visual graph on the dependencies of each component below. The arrows indicate that a certain component is dependent on the component to which it is pointing.
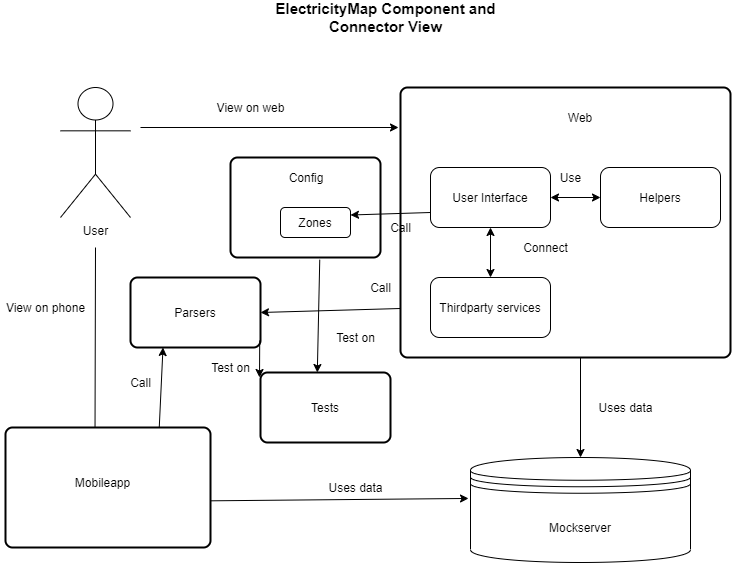
Figure: ElectricityMap Component and Connector View
From the Component and Connector view above, we can see that ElectricityMap project consists of several components, the ‘web’ and the ‘mobileapp’ components are two major components for frontend applications, the user can view the app on either the phone or the web. The ‘web’ component contains the user interface part of the project, it uses React library to help to create interactive UIs and component-based reusable objects. For the world map visualization and animation part, the ElectricityMap has used the d3.js library. The ‘config’ and ‘parser’ components are more backend components, they are either called by the frontend components ‘web’ or ‘mobileapp’ to gather energy data or to show the bounding box for different regions in the world. The component ‘mockserver’ here has a similar function to the database, it serv,es data to the ‘web’ and ‘mobileapp’ components. Currently in the Electricity Github repo, the test component is still a work-in-progress, as currently ‘config’ and some classes in ‘parsers’ are being tested, but there are clearly more code in other components that need to be tested.
The Runtime and Deployment View
The runtime view describes how components interact with each other during run time and which dependencies are used 4. As ElectricityMap is a web-based applications, no additional packages needs to be installed. The content of the website will be available once the content is loaded in the browser. Because of the simplicity of this system, and the very brief requirements, further aspects of the operational view are not worth mentioning.
Build, Contribution, and Testing of ElectricityMap
Finally, if you find this project exicting and want to contribute to this great porject, please do so. The project is actively looking for volunteers. As ElectricityMap can be built with docker, it can be run from all platforms (Windows, Linux, MacOs).
The project can be set up using the following steps:
- Set up the build environment using docker
- install parser module (using poetry)
- set up the mockserver and the website
The setup is thus very easy since most dependencies are already provided. If contributors wish to apply Currently there are no tests written for the web module except for country zoning. Furthermore, users must use lint to assess the code quality.
For continuous integration, ElectricityMap uses circleci: an CI service focusing on fast-integration. By using circleci, the testing procedure will be automated and its' logs are saved. If all autotests are passed. The pull request can be merged into the main branch.
Architecture and Key Quality Attributes
ElectricityMap’s highly containerized architecture is designed in particular with fault tolerance and availability in mind, as the backend and a platform as a whole continue to provide continuous access to users without interruption, even if a specific region’s data feed is interrupted, corrupted, or otherwise unavailable. This was a deliberate design choice to be sure, however such a setup entails a number of positive side-effects that further enhance the reliability of the platform. For example, every region on the map is dependent upon at least one data feed, accessed via a public or semi-private API which is queried in regular intervals. A region that depends upon more than one data feed experience a singular outage or interruption to the data feed, the region would still be capable of displaying the remaining data to the user. Should a region’s feed be interrupted entirely, either because it relies upon a single data source or several data sources become unavailable, the region would not display any information until the feed is restored - albeit without interrupting the service as a whole; other regions would still continue to work as intended, assuming such an interruption were a singular event. Therefore, ElectricityMap’s availability and fault-tolerance is very high.
A potential drawback to such an implementation, although largely unavoidable, is that users interested in data across multiple regions or countries could experience partial gaps in the data due to the distributed nature of the data feeds. There does not exist a singular data feed for the entire world, or even a single country (as far as the project is aware) - therefore, it can be reasonably expected that some regions may experience temporary or prolonged outages. For example, the data for The Netherlands in Q1 2021 has experienced a prolonged outage due to the fact that the sole data provider has ceased free access to their API5.
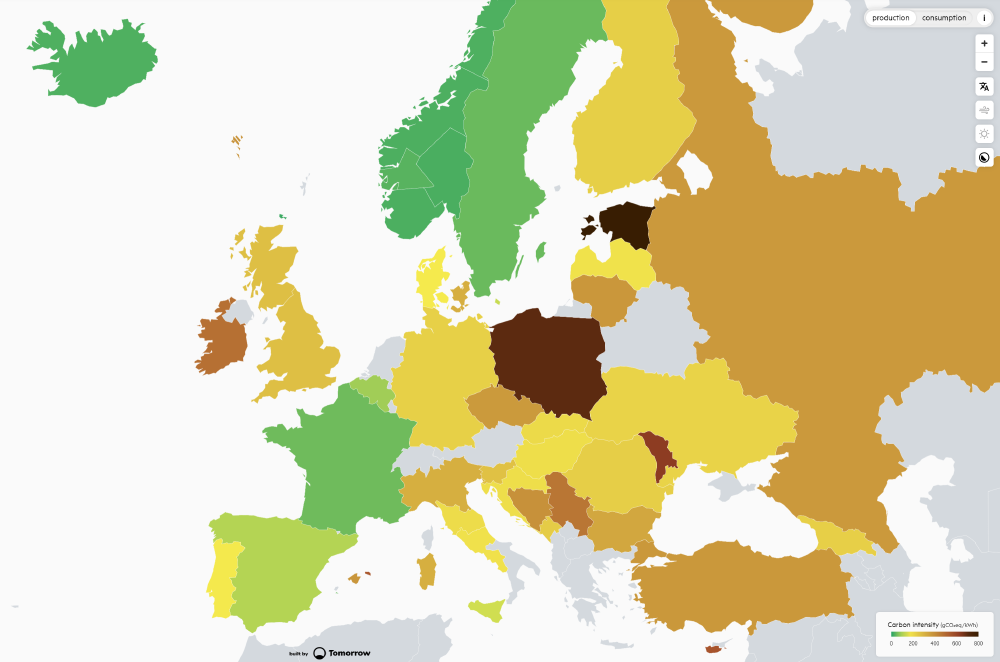
Figure: Europe Energy Production on 15 March 2021. Note that The Netherlands is experiencing an outage.
Whenever a region or country experiences an outage that prevents any production or consumption data from being displayed, the region is “greyed out” and users are displayed a message stating that the data is unavailable:
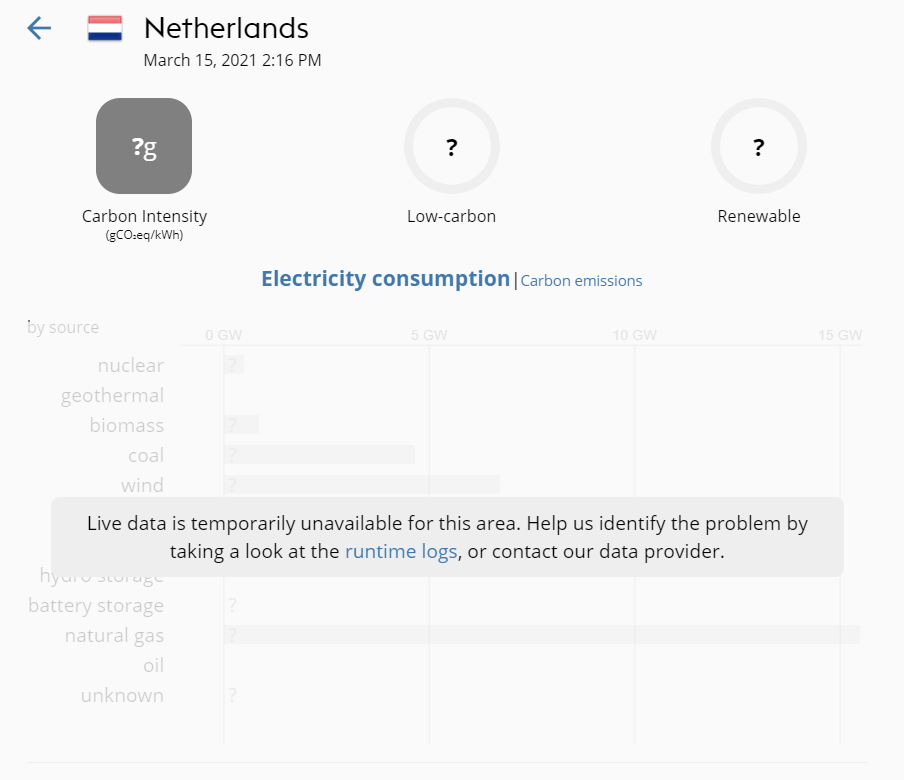
Figure: The message users are greeted with upon selecting a country or region experiencing a total data feed outage.
API Design Principles
ElectricityMap is highly dependent upon APIs from numerous indepedent sources, and therefore the design of the application as a whole must take into account the fact that each API may have differing outputs, formats, data types, and other factors. The project’s parsers each have two main methods, fetch_production() and fetch_price() (although a third method, fetch_exchange(), is sometimes included depending on whether or not the region exchanges energy with a neighboring region/country). fetch_production() requests the last known energy production numbers for a region, and depending on the region (e.g. whether or not multiple APIs must be accessed) aggregates the production numbers into a single Pandas dataframe. Since most APIs utilized in this project are independently operated and updated from one another, many of which are not open-source, the Tomorrow team is often the primary point of contact between the contributors to the ElectrictyMap project and the API providers.
Due to the widely varying API outputs, the fetch methods often differ between regions. Every region has its own parser, and each parser differs. The Tomorrow team is intimately involved in parser issues on GitHub, as it appears that many of the open issues regarding bugs require communication with API providers (changes to data formats, new table columns, etc.) which is unfortunately an unavoidable side-effect of working with a very large number of independently operated APIs to provide a software product.
Furthermore, due to the closed-source nature of the APIs utilized in this project, it is almost impossible for a non-expert programmer to determine what the individual APIs have implemented, in terms of design principles. Each parser is well-documented within the scope of the EM project, but there are little to no comments regarding the output of each API, and therefore from our perspective, each API is a bit of a “black box.” Given more time, we could go through each region’s parser and determine which APIs are open source, such that we could dissect the software engineering principles used when designing each API. However, that is outside the scope of this project given the current deadline.
References:
-
C4model. Retrieved 15 Mar, 2021, from https://c4model.com ↩︎
-
C4model abstractions. Retrieved 15 Mar, 2021, from https://c4model.com/img/abstractions.png ↩︎
-
Pautasso, C (2020), Software Architecture visual lecture notes ↩︎
-
ElectricityMap GitHub - Issue 3015. Retrieved 15 Mar, 2021, from https://github.com/tmrowco/electricitymap-contrib/issues/3015#issuecomment-787816400 ↩︎