As data scientists, we handle large amounts of data, intending to present it, analyze hypotheses, or exploring unknown information. Since data visualization is just a stepping stone for deeper analysis, we need tools that offer this layer in a flexible and easy to use manner.
Matplotlib aims to enable users to create customizable visualizations through various components or third-party tools, at high resolution, with publication quality, all in a few lines of Python code. They state that the library “makes easy things easy and hard things possible”.
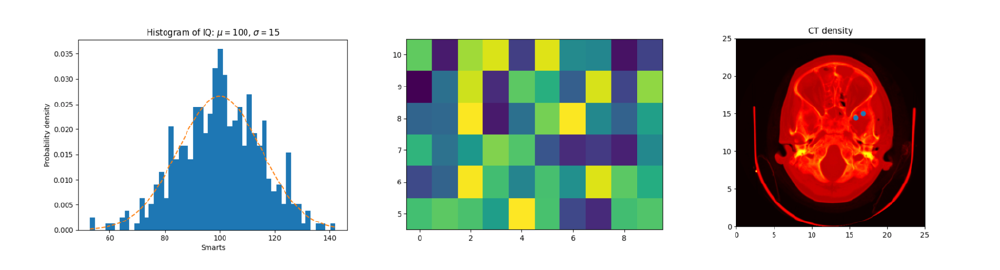
Figure: A shallow preview of what matplotlib can create
The library offers advanced visualization tools, allowing users to do storytelling with data, with full control over customization and options to extend through third-party packages. Thus, the library serves as a layer between raw data and the possibility to analyze it thoroughly.
Modelling the real world
To achieve these complex goals, the domain is modeled in such a way that it reflects data visualization principles, with clear guidelines and best practices when it comes to visually previewing information. As the author makes it clear, the truth about the underlying domain is that plots and the text describing them should look great, should be easy to create and the code must be easy to understand and extend, which makes a lot of sense from the user’s perspective.
To be more specific, the basic building blocks of the domain are graphs, mostly 2D and 3D, either displayed standalone or in organized grids, generated by data in various shapes and formats. Those can be used either in a static way, as images, or through an interactive widget, which allows the user to zoom, shift or translate the view of data.
Matplotlib was architected specifically for research purposes, with on demand publication quality plots capabilities. Besides this, it is versatile enough to generate figures for desktop or web apps.
Capabilities of Matplotlib
Next, let us look more at the capabilities of Matplotlib. In short, Matplotlib is a graphics package for Python and has, at first sight, the same graphical capabilities as MATLAB but that is to no surprise. John D. Hunter began developing Matplotlib because he had certain needs that were not supported with MATLAB, which were 1:
- Embeddable GUI.
- Support for different platforms.
- Offer extremely high-quality raster and vector hardcopy output for publication.
- Provide support for mathematical expressions and work interactively from the shell.
This list was the basis of the earlier builds of Matplotlib. As of 2007 it runs on all major operating systems, can be embedded in a wide range of GUIs, has vector outputs, supports TeX and LaTeX for text and mathematical expressions, supports major 2D plot types and interactive graphics, including XY plots, bar charts, pie charts, scatter plots, images, contouring, animation, picking, event handling, and annotations 1.
Matplotlib has an active community and development was never halted. John D. Hunter did not implement 3D visualization because he taught it to be out of his scope but the community has implemented it with a toolkit, called Mplot3d for example. Even after the passing of Hunter in 2012 new functions and toolkits are still implemented for Matplotlib by the community.
The possibilities for visualizing data with Matplotlib are wide but the selling point is that it needs to be easy to use by many, even if you are not a programmer. For example, if you want to plot simple data without extra stylization you can easily do that in a single line of code.
Matplotlib.pyplot.plot([1,2,3,4],[1,4,3,2])
For the more adventurous it is entirely possible to edit a figure or canvas as you would like with the many classes and functions of the package. Examples include; adding GUI widgets, customising legends, changing the axe limits, setting titles, labels, line styles and colors and adding text or paths to the canvas. All these examples of course will work within the different capabilities like discussed earlier.
The context in which Matplotlib operates
Matplotlib is generally used by two types of users; the programmer that uses the package to visualise data and the observer who views the finished product. Offcourse the programmer can also use the data for personal research and could therefor be both.
Matplotlib itself works currently within the Python environment but is not completely dependent on core Python alone. According to the documentation provided on the Matplotlib website the package depends on the following Python libraries:
- NumPy
- setuptools
- cycler
- dateutil
- kiwisolver
- Pillow
- pyparsing
And a few optional dependencies that enable extra features like better GUI control.
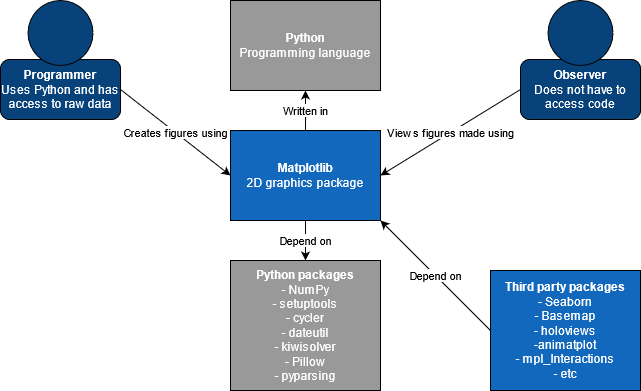
Figure: The context view of Matplotlib
The most notable dependency is Numpy as it is heavily used in Matplotlib. This of course comes from the fact that Matplotlib is designed as an alternative to the graphical capabilities of MATLAB. But Matplotlib only focuses on the graphical aspect. Luckily a fundamental package for mathematical capabilities already exists in the form of NumPy.
Because of the wide popularity of Matplotlib other packages are also developed that depend on Matplotlib. The most widely known example is Seaborn. Other third-party packages range from mapping toolkits, declarative libraries, animations, and interactivity.
Stakeholders of Matplotlib
To create a satisfactory system, software architects must consider the needs of every stakeholder of the system in the decision-making process. Stakeholders are entities that has an importance and interest in a system. We will be using Rozanski and Woods’ stakeholder classes 2 to identify the stakeholders of Matplotlib.
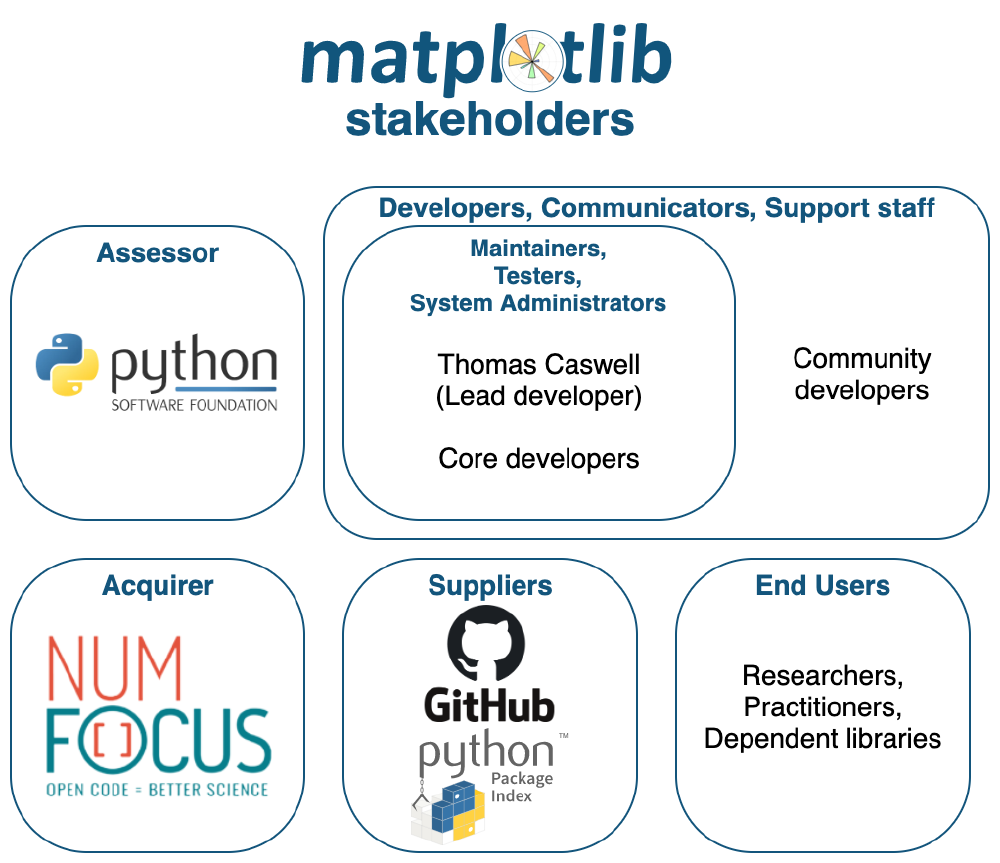
Figure: Overview of Matplotlib stakeholders
Acquirers: Matplotlib has no corporate sponsors but is funded through donations via the NumFOCUS organization3. As Matplotlib is an open-source system, their interest in the system is different from that of a purchaser of closed-source software. While they are also interested in the correctness and reliability of the system, they are largely interested in the growth of the system, such as the creation of new features, and the growth of the developer community.
Assessors: The Python Software Foundation regulates the compliance of the system to Python standards.
Suppliers: The development and distribution of Matplotlib are hosted via GitHub and PyPi.
Developers: The developers consist of core developers and community developers. The core developers are led by the lead developer, a role first held by John D. Hunter, the creator of Matplotlib, and now held by Thomas A. Caswell. Core developers are active contributors that also review contributions to make sure of its compliance to the system as a whole, and guide new community developers. Developers are interested in producing components of the software, using existing components of the software to create new ones, and maintaining or fixing existing bugs.
The developers of Matplotlib wear many hats in the system, such as communicators, maintainers, support staff, system administrators, and testers. Lead and core developers especially act as maintainers, testers, and system administrators. As communicators, the developers are interested in explaining the whole system in the form of documentation, which can be accessed by all stakeholders. As maintainers, lead and core developers are especially interested in keeping the integrity of the system.
End users: Matplotlib is used in academia, national research labs, and industry. Research that has used Matplotlib varies in fields, from physics to chemistry, neuroscience to astronomy. Notably, NASA has used Matplotlib on their projects, such as the Hubble space telescope. Other users to be considered are users of Python libraries that use parts of Matplotlib inside their library, such as scikit-learn, seaborn, pylab, and many others. The users of Matplotlib need the system to be correct, robust, and easy to use. They are usually not interested in the inner workings of the system, just that the system works correctly so it can help the users’ work.
Key quality attributes
Software architects must also define the main goals that the system is expected to achieve and the measurement of those goals before designing the system. These are defined by characterizing the key quality attributes that the system must meet. There are two types of quality attributes in terms of the stakeholder they relate to, internal and external4. Internal qualities concern the developer’s perception of the product and external qualities concern whether the product satisfies the stakeholder’s requirements.
The open-sourced aspect of Matplotlib causes several internal qualities to be crucial in the system. To allow everyone to contribute to the software, clarity is very important. Community developers need to understand the design of Matplotlib in order to contribute. This quality is achieved by creating clear documentation and contribution guidelines.
Design consistency is another key quality attribute in Matplotlib. To keep the architecture’s integrity and coherence, it is important to set standards such as naming conventions and rules for developers to follow. An architectural style also needs to be chosen to guide the design of the system.
An open-sourced software is constantly changing. To allow these changes, Matplotlib needs to have the qualities of extensibility and modifiability. Extensibility allows new functionalities to be added to the system and modifiability allows the existing functionalities to be altered or removed from the system, depending on the need. To control these changes, versioning is essential for the system.
The next key quality attributes to be identified are external quality attributes. In terms of functionality, one of the most essential quality Matplotlib must have is correctness. Users expect the visualization to be true to the data they input, and without this quality, the software is not usable for them. To satisfy users’ needs, the system also needs to have the quality of usability. While traditionally this would mean a user-friendly interface, as a library Matplotlib achieves this by creating a comprehensive user guide and tutorials that allow users to understand the functions in Matplotlib.
Roadmap
As for large structural changes to the project, Matplotlib does not offer a general roadmap made by the lead developers. Instead, besides the ongoing bugfixes and smaller improvements, radical changes can be proposed by community members by means of Matplotlib Enhancement Proposals (MEPs). There are no official dates connected to the MEPs, instead relying on volunteers to implement them. All MEPs can be found on the project’s official website 5 and can be categorized into either having been implemented, being in progress, or being discussed.
Example MEPs are number 14 and number 29, which both focus on improving the use of text in visualizations. Currently, Matplotlib’s text-engine only supports left-to-right text and cannot handle automated line-breaking, instead relying on users to break lines manually. Moreover, it does not allow certain Unicode features or include the possibility to apply HTML, Markdown, or LaTeX math mode (without having to install LaTeX itself). These are features that should be possible to include in projects and are therefore being discussed through these MEPs.
Another MEP that is being discussed is MEP9, focussing on dynamically dragging and dropping items in a visualization. The MEP proposes to add a global manager for all user interactivity with artists. Artist is the base class of all visible elements in a figure. The position of items is decided before the visualization is rendered and cannot be changed after the fact. Therefore, if one of the elements should be positioned differently, a user needs to delve into the code. This MEP, too, is still in the discussion phase.
Ethical considerations
Matplotlib is, on a high level, a highly configurable graphics library, specifically for visualizing data. The decision of which visualization should be applied to which data lies entirely with the user, as the library cannot make such judgment on its own. The library should, however, try to aid the users to create proper visualizations with its default settings. Certain visualizations of data could lead to wrong implications, which should be avoided.
Bar charts, for example, should by default start at zero rather than at a higher level, to prevent biased views. Starting the bars at a higher level would visually imply that the difference between the two bars is bigger than it actually is. The next figure shows how Matplotlib’s default settings show bars starting at zero.
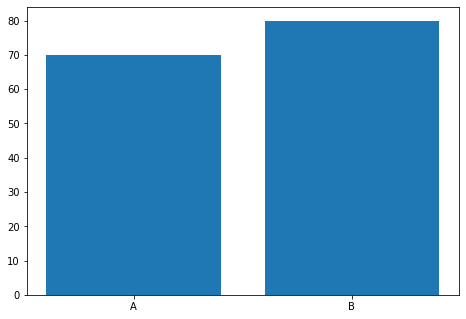
Figure: Proper bar alignment
An improper way of showing a bar chart would be the following figure, in which the default settings are overwritten. It shows the same data but causes it look as though the difference between ‘A’ and ‘B’ is much larger than it actually is, by starting the bars at a higher level.
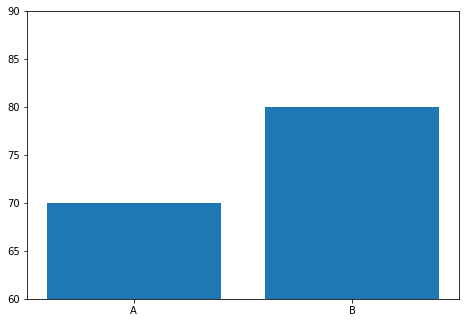
Figure: Improper bar alignment
-
J. D. Hunter, “Matplotlib: A 2D Graphics Environment”, Computing in Science & Engineering, vol. 9, no. 3, pp. 90-95, 2007. ↩︎
-
Rozanski, N., & Woods, E. (2012). Software systems architecture: working with stakeholders using viewpoints and perspectives. Upper Saddle River NJ: Addison-Wesley. ↩︎
-
Cesare Pautasso. Software Architecture: Visual Lecture Notes. Leanpub, 2020. leanpub.com. ↩︎
-
Hunter, J., Dale, D., Firing, E., & Droettboom, M. (2021, January 28). Matplotlib Enhancement Proposals. Matplotlib. https://matplotlib.org/devdocs/devel/MEP/index.html ↩︎