From one liner figures to full customizabilty
Matplotlib is a standalone visualization component, used by users in different contexts, for different use-cases, within the Python environment. It offers multiple levels of abstraction and customization, having a layered architecture, with 3 main building blocks: scripting, artist, and backend. 1
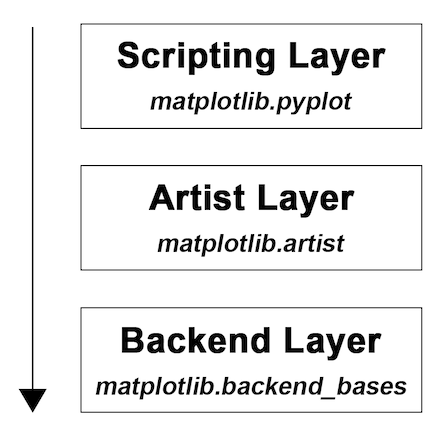
Figure: Matplotlib’s layered architecture
Now, let’s zoom in each one.
Scripting - mimics MATLAB’s interface
In our first essay we emphasized that the “why” behind matplotlib was to replicate the ease of use of MATLAB. The scripting layer does just that, offering the users some easy-to-use methods for generating plots in only a few lines of code.
Artist - makes things look better
This one is responsible for making this look great. Every small piece of a visual component is an artist, from the lines to the labels, allowing people to fully customize their results, just like “an artist paints on the canvas”.
Backend - does the heavy lifting
It is the most complex and low-level layer, handling interaction with different environments for drawing, reacting to events, and rendering figures, through its 3 main components, FigureCanvas, Renderer and Event. Although possible to interact with, users often don’t directly use this layer, due to complexity reasons. It offers marginal gains, at a high cost.
Container View
Matplotlib can be accessed via several software systems: Python shell or program, Jupyter notebooks, GUI applications, or web application servers. These interfaces access matplotlib library by making API calls to a specific API, of which Matplotlib has three kinds. These APIs can be considered the containers of Matplotlib. These three types of APIs of Matplotlib are PyPlot API (plt), OO API, and PyLab API.
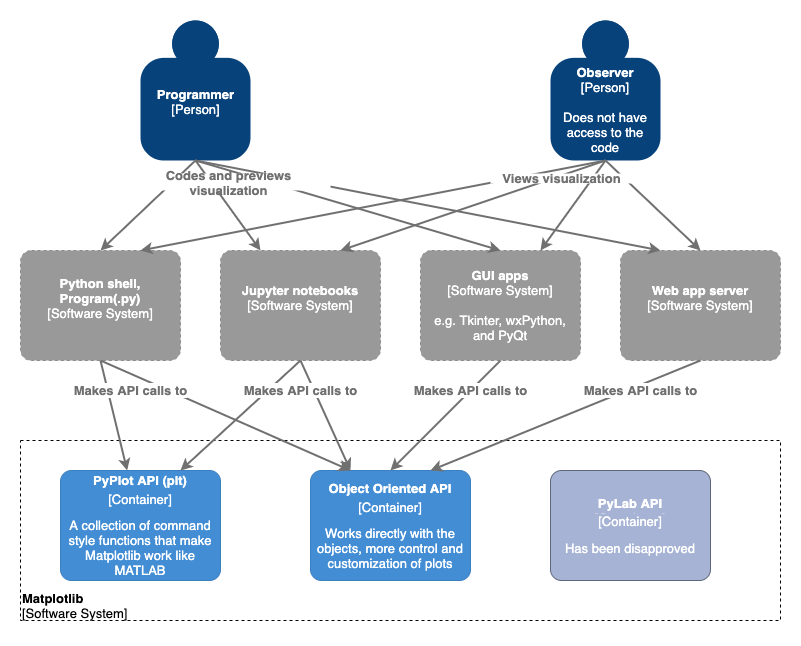
Figure: Matplotlib’s container view
PyPlot API
PyPlot API, commonly known in its use as plt, is intended to simulate how users would work with MATLAB. PyPlot is a state-based interface that can generate graphics easily and quickly. However, this API is limited in the complexity and customizability of graphs that can be generated, and therefore mainly used for simple graphs and interactive plots. This API is accessible through Python shell and program, and also through Jupyter notebooks
Object Oriented API
Matplotlib is at its core an object-oriented library. To have full control over the graph, users access matplotlib via OO API. Through this API, users can create, control, and customize plot elements (e.g. Figure and Axes) explicitly. With this capability, users can create more complex visualizations with this API.
Python shell and program, as well as Jupyter notebooks can also access matplotlib via this API, but GUI applications that use matplotlib and web application servers commonly only use this API.
Components View
Zooming into the containers, this is where the layers discussed in the first part of this article comes into play, where they can be considered the components of matplotlib. Both APIs still in use today, PyPlot and OO API, have the same Artist and Backend layers. The difference between the APIs, as discussed in the previous section, is the level of control over the visualization. This is caused by the different access points they use.
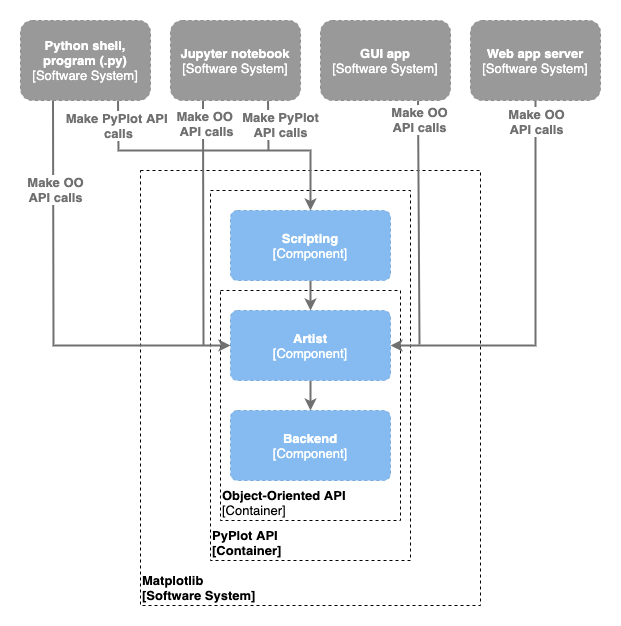
Figure: Matplotlib’s component view
Scripting
The Scripting layer provides a wrapper around the Artist layer that simplifies the commands by handling most of the repetitive codes used to create Figure and Axes in Artist layer. However, this simplification results in limited control over the resulting graph, as the Scripting layer already creates the Figure and Axes objects for the user, and the user can only work on those objects.
Artist
The Artist layer is the core of matplotlib, where much of the work is happening. Everything in a matplotlib graph is an Artist instance; the labels, title, ticks, lines, and so on. The OOP API interacts directly with this layer, explicitly creating Figure and Axes and calling methods on them, which gives users total control over the graph.
There are two types of Artist instances: primitive and composite artists. Primitive artists represent the kinds of objects visible in a plot: Line2D, Rectangle, Circle, and Text, whereas composite artists are collections of Artist instances, such as Axis, Tick, Axes, and Figure.
Backend
The Backend layer is responsible for the implementation of the code and handles the different environments the users are using matplotlib in. Whereas Scripting and Artist layers can be considered the “frontend” of matplotlib as the user facing plotting code, the Backend layer does the work of creating the figure.
It consists of three components: FigureCanvas, Renderer, and Event. FigureCanvas is the canvas the figure renders into, depending on the environment the user is operating matplotlib and their request, Renderer is responsible for actually rendering the figure into the canvas, and Event handles user inputs, such as clicks.
There are two types of backends: user interface backends or interactive backends (used in all interfaces but especially GUI apps), and hardcopy backends that create image files of various formats. Users can set the backend explicitly, but Matplotlib automatically detects a usable backend based on the user’s system and on whether a GUI event loop is running, which is why this layer is rarely used by the regular user.
Connectors View
In the last section we have seen the different components of matplotlib, but how do these components connect? Each component can communicate with functions in its layer. The Event component can interact with the Renderer for example in the backend layer. The lower layers also can act independently from the higher layers while the higher layers depend on the lower layers. The Artist layer will, with help of its classes and functions of the same level, call upon the backend layer to guide the backend layer on what is needed to be drawn. The Artist layer is already all you need to plot most figures, but to make matplotlib more user-friendly the scripting layer will call the right components of the Artist layer for the task given.
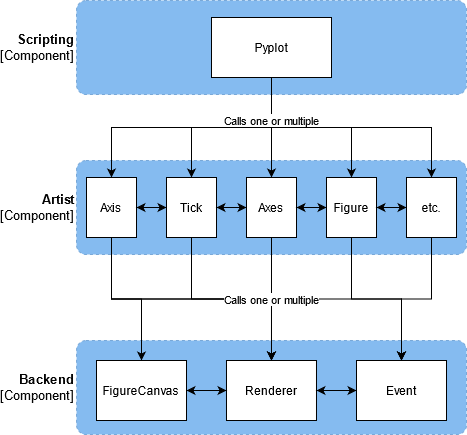
Figure: Matplotlib’s connectors view
Development View
Matplotlib has different tools and documentation to support community developers with contributing. Also because you don’t need to invent the wheel twice, there are different platforms and packages that matplotlib depends on. In this section, we will go into these development decisions and dependencies.
Dependencies
The most used dependency is NumPy. In the documentation it is nearly used for every example but also in the code depend on it. A lot of functions in matplotlib make use of the array transformations, array iterations, and floating-point special values from NumPy. Some examples are the uses in Figure for axis alignment and checking for feasible limits, Axis where it is used for rounding and transforming the input, and Pyplot where it is used to visualize matrices in plots.
Other dependencies with more specific roles are also used. Some of these dependencies are:
- setuptools: checks the dependencies and builds the package;
- Cycler: creates iterable objects;
- Dateutil: parses dates;
- Pillow: processes images;
- Pyparsing: alternative to regular expressions for parsing strings.
Contributions
Matplotlib has over a thousand contributors and has detailed guidelines on their website for contributing 2. This guideliness include the usage of the numpy docstring standard, PEP8 formatting, and editing corresponding documentation and examples. They request that every contribution should be tested, done with pytest. Some tests, like checking if the documentation builds correctly, are also tested after every commit.
Most contributions are a response to issues added to Matplotlib’s GitHub and pull requests are handled accordingly. But for large or controversial changes to matplotlib the Matplotlib Enhancement Proposals is used 3.
Documentation
The documentation for matplotlib is built from the doc/, tutorials/ and examples/ directories and already includes configurations for Sphinx and reStructuredText. These files are then rendered to the documentation pages. Sphinx creates .rts files from the docstrings of the classes in the matplotlib library. This way the documentation will update after every closed pull request.
Directory Structure
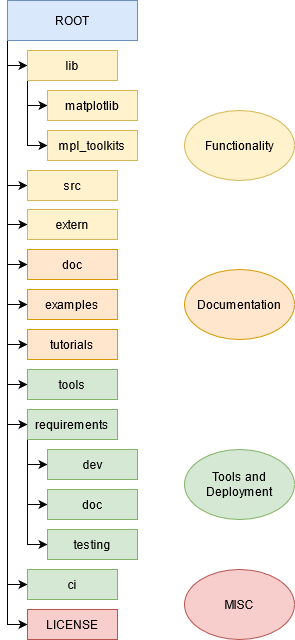
Figure: The direcotry structure of matplotlib
The directory structure can be divided into four different categories as shown in the above figure. The functionality folders contain the main capabilities of matplotlib with the lib folder containing the python code and src folder containing C for optimization.
The documentation folders contain both the documentation written by contributors as generated Sphinx files. Both examples and tutorials contain folders and files to help users understand the functionality of matplotlib.
The folders and files in Tools and Deployment are primarily aimed at securing the development of matplotlib by both having tools for specific purposes and having code for testing the requirements for matplotlib and checking the overall code of new contributions.
Run time view
When running code, if it was written in OO-fashion, the scripting layer creates the artist modules using default configurations. Else, this layer will be skipped entirely.
The artist component communicates to the backend layer using the draw method. Artist does not know how the backend will visualize the image, whether it will produce a static image or an interactive GUI, but does know what components it should communicate to, and which methods to call from the backend layer.
The backend layer contains the implementation which can communicate with the user interface framework of choice. For PNGs specifically, Matplotlib’s backend renders images using the C++ template library Anti-Grain Geometry.
For interactive user interfaces, the user can enter their requested changes to the visualization via an interactive shell, for which IPython is recommended 4. For interactive visualizations, the user has already declared which artist methods should be called when inputs are triggered, which in turn will communicate these changes to the backend via the draw method.
Key quality attributes
There are three key quality attributes, being customizability, simplicity, modularity, and design consistency, which are described in the book 5.
Regarding customizability, Matplotlib offers two approaches for users to write scripts as explained in the previous section. The first of which allows users to easily visualize data with the default settings by calling the scripting layer, also ensuring simplicity. However, if users desire more control, they can skip the scripting layer and directly call objects in the artist layer, which allows them to be more creative.
All of these objects, whether they are in the backend, artist, or scripting layer, are modules 4, ensuring the modularity attribute. This design allows for easy addition and reusability of code, since many added modules would not depend on one another, and thereby will not influence each other’s behavior if changed.
The fourth quality attribute is design consistency, where the project is documented and stylized according to numpydoc and pep8 syntax. This makes sure that it is easier to develop for Matplotlib, or to understand how to use the library, but it also poses some challenges. Matplotlib was created before Python version 2.6 was released, which introduced properties, removing the need to explicitly create getter and setter methods. All modules within the artist layer contained these getter and setter method, and it was decided that developers would have to continue this trend, even though without consistency, this was not necessary.
Does matplotlib have a nice API?
Although matplotlib’s principles apply to many theoretical API design principles, to capture the gist, the 80%, only a few would be described below.
Uniform access principle
Regardless of using the procedural API or the OOP one, the functionalities are syntactically consistent, offering uniform, intuitive access across usage flows. For example, PyPlot offers the method plt.title("Title"), while the OOP API exposes the same functionality through fig.set_title("Title").
Design from client’s perspective
Highly linked with the “why” of matplotlib, the API is designed to be easy to use, to get things done quickly, without tedious work. As a user, if I quickly want to analyse the data, I can do plt.plot(x,y) or plt.hist(data), getting a decent UI that, as said before, gets the job done seamlessly.
Clear interfaces principle
As a side note on the previous principle, I am also a matplotlib user, but I seem to never be able to memorize the exact API. Luckily, they have designed it in such a way that it maps to the specific terminology. Let’s say I have some 2D dataset, I want to see how it looks and I want to scatter it. Without further do, plt.scatter(X,Y) gets the job done. With some basic autocomplete feature in your IDE, matplotlib does what you think of.
Few interfaces principle
As stated before a few times, matplotlib is complex on a few verticals but simple on the horizontal. When working with the library, you either plot a standalone graph or define a grid and then interact with each standalone figure. In any case, the API is the same, thus it subscribes to the “few interfaces” group, keeping things easy for the client.
-
Jun Ye, “plt.xxx(), or ax.xxx(), That Is The Question In Matplotlib” towardsdatascience.com ↩︎
-
Matplotlib, contributing. https://matplotlib.org/stable/devel/contributing.html ↩︎
-
Matplotlib Enhancement Proposals. https://matplotlib.org/stable/devel/MEP/index.html ↩︎
-
Hunter, J., Dale, D., Firing, E., & Droettboom, M. (2021, 28 januari). Overview - Matplotlib 3.3.4 documentation. Matplotlib. https://matplotlib.org/stable/contents.html ↩︎
-
Pautasso, C. (2020). Software Architecture: visual lecture notes. Leanpub. https://leanpub.com/software-architecture ↩︎