The overall software quality of matplotlib
Having a general software quality process means that all contributing parties understand the requirements and the project’s contribution guidelines. Matplotlib ensures this by providing an elaborat developer’s guide, even detailing to people who have never used it how to use git, which potentially helps non-tech-savy maths people who are interested in contributing. These guidelines ensure that contributions are consistent.
First and foremost, the guide explains what kind of contributions can be made and what the coding guidelines are. Second, the guidelines provide tips for testing, showing that this is a priority for Matplotlib. Examples of such tips are where to create and how to run create tests, including how to use CI and how to use tox to test new code against various Python environments.
Moreover, there is an explanation on how to write documentation, detailing the conventions for style and formatting. There is even a separate section on how to create PRs.
Many times, if contributions do not adhere to the guidelines, this will be pointed out in the discussions on GitHub, where either the original contributor or someone else will have to apply the changes before being accepted.
The key elements of the system’s continuous integration processes
The continuous integration process of Matplotlib consists of roughly 40 steps. The first step is building CI wheels. Building CI wheels speeds up the testing process by creating a format ready for installation, allowing the system to skip the building stage. The CI wheels are created for each version of Python, its packages, and the platform on which it can run. After creating the wheels, the test suite is run on all combinations.
Meanwhile, linting is performed, which checks whether the coding style is uniform, and provides feedback on syntax errors or bad formatting. This too, is important when contributing to Matplotlib, as the guidelines for styles are very descriptive. The tools used for this are eslint and flake8.
Something else the CI process deals with is security. LGTM checks whether the code changes expose any zero-day and critical vulnerabilities. Moreover, in terms of security, the code coverage is checked by Codecov, to see which lines of codes were executed by a test suite, currently reaching 84%.
| Tests | Build pipelines | Package build | Code coverage | Code quality |
|---|---|---|---|---|
 |
The rigor of the test processes and the role of test coverage
When contributing all changes must be thoroughly tested as per the contributing guidelines. This is done with pytest. Testing is done because of a few reasons. First of all your changes should not cause other elements of matplotlib to fail. Known failing tests are added to the test suite so that the build bots can run it. It is therefore important if your tests for your additions are known to fail they should also be added to the test suite. So if your pull request is approved your changes should be tested in the future when other contributors change the code. When adding tests you should also categorize them as to the guidelines. Also because some tests like pyflake and unit test coverage are done in the CI you should also test these beforehand. Matplotlib strives to get the unit test coverage of at least 70% 1 on new additions.
How did hotspots shift over time
As emphasized in our second essay, matplotlib was originally designed to operate through 3 different APIs, built for different purposes. Originally, the pyplot API, the object-oriented API, and the pylab API were the hotspots of the plotting library. The first 2 are still in place serving real purposes, but the last one has been disapproved, because it did not comply with the best practices, importing all the functions in the same namespace. This might work for MATLAB, but since matplotlib is used also in automated workflows, filling the memory with unneeded dependencies did not scale well.
If we would picture the component decomposition of matplotlib as a tree, it would be shallow and wide. All the artists (displayable components) are widely spread just under the matplotlib package, being easy to pick without traversing long directory paths. Even though each small component can be plugged directly in any matplotlib context, the two big hotspots are Axes and Figure objects. Due to the functional nature of matplotlib those centers of their infrastructure are unlikely to change, although a clear roadmap is not explicitly provided.
Code quality and hotspot components
Matplotlib is very wide in their component library, but the code style and quality are ensured across all with some strict guidelines and checks. The most basic and very effective enforcement is PEP8, which is no more than a style guide for Python code, that provides some best practices for code writing, that aim to make it easier to understand, test and maintain. Those rules keep the code organized and, when configured properly, help the programmer write better code by default.
When it comes to code documentation, the chosen style is numpydoc which documents the attributes of a class and the parameters of a method. Since Figure is the hotspot of matplotlib, two brief chunks of a class and method docstrings would be presented below:
  The top level container for all the plot elements.

  The Figure instance supports callbacks through a *callbacks* attribute
  which is a `.CallbackRegistry` instance.  The events you can connect to
  are 'dpi_changed', and the callback will be called with ``func(fig)`` where
  fig is the `Figure` instance.

  Attributes
  ----------
  patch
      The `.Rectangle` instance representing the figure background patch.
  Parameters
  ----------
  figsize : 2-tuple of floats, default: :rc:`figure.figsize`
      Figure dimension ``(width, height)`` in inches.

  dpi : float, default: :rc:`figure.dpi`
      Dots per inch.
Besides the must-have docstrings, the code also has comments in the areas where the code itself is noted verbose enough, or where additional motivation is needed for some specific lines.
Even though it is not automatically enforced by a linter, the code quality is high when it comes to naming conventions. It is easy to understand just by reading it and, as emphasized in a previous essay, the API is intuitive to use since the data visualization actions and principles are mapped directly into code.
Quality culture
As an open-sourced system, numerous developers are contributing to Matplotlib, and the core developers are responsible for maintaining the quality of the system. They do this by first providing an up-to-date comprehensive guide2.
As also emphasized before, most of the discussions regarding changes and new features take place on issues and pull requests on Github. At a first sight, there is a lot of movement in the community around those, with roughly 1.5k issues and 300 pull requests at the time of writing this essay. Diving deeper, the first thing that pops out is the very neat organization of concerns. They have over 100 labels for issues, with specific purposes, meant to split the discussion threads. Also, they divide issue types into Bugs, Documentations, Features, Maintenance, and other logistic categories, with a predefined template for both issues and PRs, with checkboxes for developers to check before they submit their change.
Maintainers make use of these labels to keep track of the PRs and issues actively. Aside from labeling the type of PR/issue, labels are often used and actively changed to indicate the progress of the PR (an orphaned PR, work-in-progress, etc), as seen in PR#17488 and to indicate what other contributors can do for the PR (needs testing, discussion, etc), as seen in PR#17182. Similarly, issues that are not explained clearly enough to be worked on like PR#19730 are labeled as ‘status:needs clarification’.
As described previously, the MEP (Matplotlib Enhancement Proposal) is the way people suggest major changes to the plotting library. Some of them span over years, being actively updated and solved.
MEP22 is one of the most active ones, aiming to change the way users dynamically update widgets, making their workflow easier. Although these changes span over multiple issues and pull requests due to their complexity, each of them has a high volume of comments and discussion threads, where decision makers evaluate the proposals of developers, building a constructive conversation, making use of all the tools to enhance expressivity, such as references, screenshots, tables and code chunks.
When you try to present something through a visualization, text is often a very useful tool, whether for naming axes or for further describing the figure. MEP14 handles exactly this, improving the way text of different fonts and types is displayed by matplotlib components. The quality culture is once again evident in the discussions of the issues solving this problem. People clearly explain their plan and thoughts, present actual code chunks that would benefit from solving the issue, and make sure the checklist is completed. At the same time, the CI does its due diligence to make sure everything stays within quality standards.
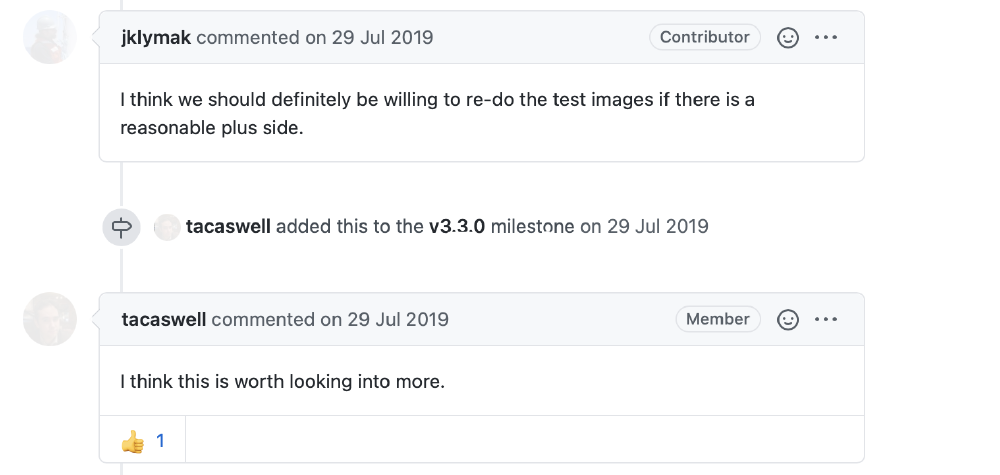
Figure: Actual issue discussion.
To make sure everything works well and matplotlib respects the initial “why”, lead developers take part in discussions, propose changes, and set milestones to make sure everything is organized.
Let’s move on to an issue that emphasizes the quality culture in two different ways, by its essence and by the way people get the issue fixed. MEP10 has the simple purpose of enforcing docstring consistency. This is beneficial in many ways, showing that quality is an important concern. They want their code not only to create nice figures but also to be understandable, easy to maintain, extend and use. Thus, they propose a uniform docstring style, which can be automatically parsed for documentation, like this:
def annotate(self, *args, **kwargs):
    """
    annotate(s, xy, xytext=None, xycoords='data',
               textcoords='data', arrowprops=None, **kwargs)

    Create an annotation: a piece of text referring to a data
    point.
    """
As additional quality enforcement, they also propose some tests for documentation, to make sure everything is parsable and understandable from an automated documentation building point of view.
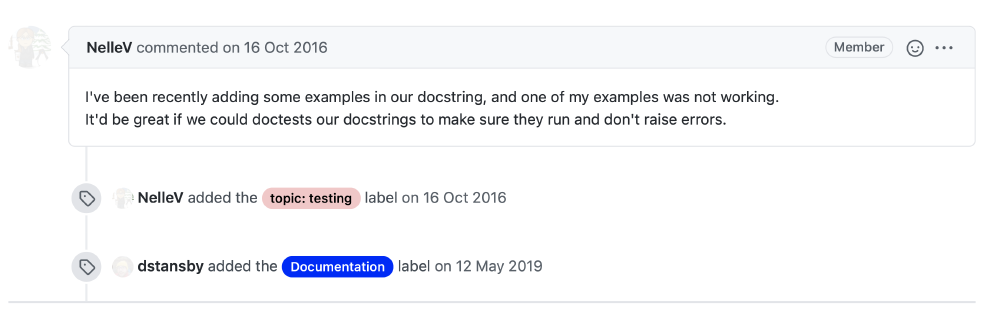
Figure: Proposing a new quality measure.
Matplotlib core developers act as maintainers and are very responsive, responding within a day to most issues and PRs. This responsiveness is important in maintaining quality, as the discussions in the issues and PRs are often key to solving the problem. In issue#10016, the discussion reveals that the cause is not what the issue initially suggests, which is a technical problem, but rather a problem of old documentation not being clearly labeled. Many other issues stem from this problem as well, as evidenced by many mentions of this issue in other issues (e.g. issue#13193). This leads to a name change of issue to directly address the root cause and then fixed by PR#49.
After a PR submission, CI checks discussed previously are conducted, and with approval from a maintainer, can be merged to the master branch. Some of the simpler PRs that don’t need discussion, like PR#19716 are merged immediately. However, more complex PRs (PR#16603 and PR#18275) are discussed at length.
Matplotlib developers are committed to maintaining quality by addressing the root cause of the problem instead of just fixing the surface problem. We can see this in PR#15065 that has been worked on and discussed at length is not merged because it does not address the underlying issue, and therefore avoiding code smells.
From this analysis, we can conclude Matplotlib has a good quality culture, with active discussions about possible solutions to issues and PRs. To keep track of the PRs and issues, matplotlib maintainers use an extensive set of labels effectively.
Technical debt analysis
Technical debt, a term coined by Ward Cunningham in 1992, measures the amount of effort needed to fix the buildup of deficiencies in system quality that makes system modification and extension difficult 3. This deficiency is usually spotted by finding ‘code smells’, which is a surface indication that suggests a deeper problem in the system 4. The figure below shows the technical debt analysis of Matplotlib using SonarQube.
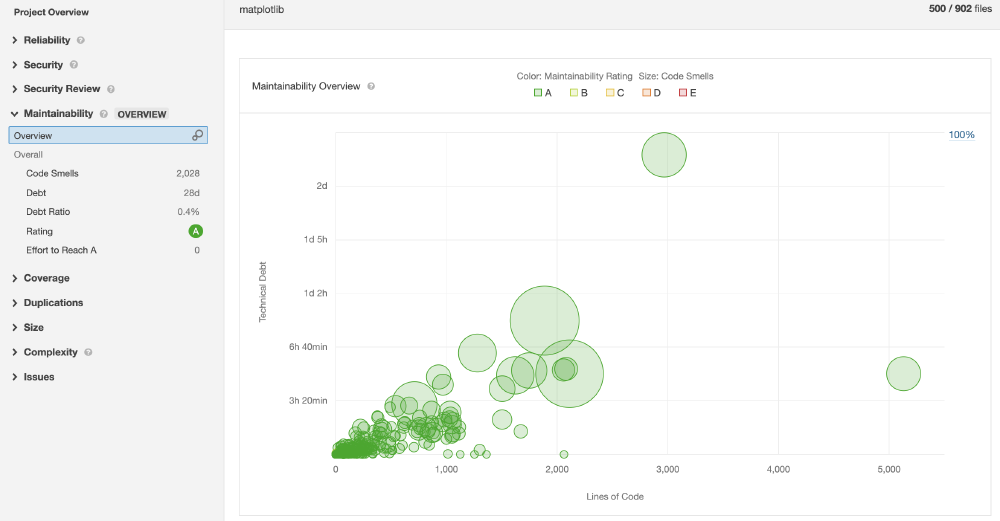
Figure: SonarQube technical debt analysis
SonarQube rates the Maintainability of a system by calculating the Technical Debt Ratio, which is a ratio between the cost to develop the software and the cost to fix technical debts. Matplotlib scores highly in this respect, with a 0.4% ratio. There are still 2k code smells that result in technical debt of 28 days. However, this static analysis is using SonarQube’s default rules, not matplotlib-specific rules, which might cause some noise in the analysis. Upon investigating these code smells, we discover the majority of these issues are about bad coding practices. One example of such a case is presented below.
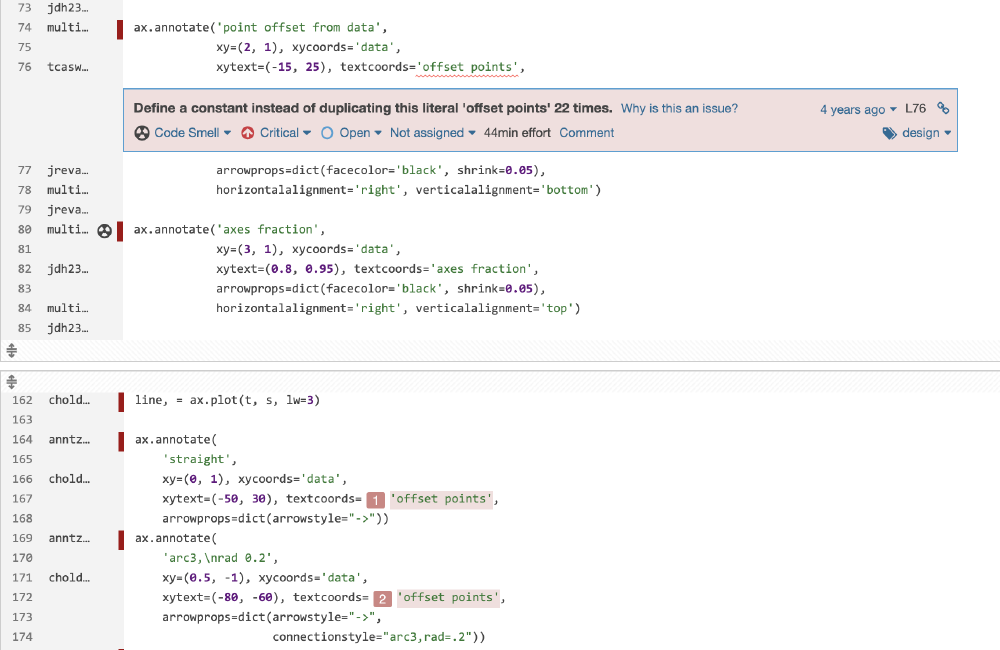
Figure: Bad coding practice example
This code smell roots in duplicating the string 22 times in the code instead of defining a constant. Using a constant instead can help avoid future problems if the value needs an update. This issue occurs 198 times across the codebase.
This analysis of matplotlib suggests a need for some code tidying. However, the current code quality processes employed by Matplotlib as discussed above can be considered to be performing well, as the overall technical debt of Matplotlib is very small for a software its size.
-
Matplotlib Contributing pull requests, https://matplotlib.org/stable/devel/contributing.html#contributing-pull-requests ↩︎
-
Fowler, Martin. “Bliki: Technicaldebt”. Martinfowler.Com, 2019, https://www.martinfowler.com/bliki/TechnicalDebt.html. Accessed 18 Mar 2021. ↩︎
-
Fowler, Martin. “Bliki: Codesmell”. Martinfowler.Com, 2006, https://martinfowler.com/bliki/CodeSmell.html. Accessed 18 Mar 2021. ↩︎