In earlier essays, we have discussed matplotlib’s product vision, architecture, and quality and evolution 1 2 3. In this essay, we will focus on the variability features of matplotlib. Matplotlib is an open-source graphics package for python so all features are essentially available for every user without a need to select them from a distributor or something. It is however up to the user to customize the software to their demands. Some users might not understand the deeper layers of matplotlib while other users find the higher layers to limiting for their needs. Matplotlib also allows users to run the library on all operating systems and various versions of Python. For the feature model, we will identify matplotlib’s variable features and incompatibilities. It is important to note that most of these features are never locked out but might go unused by the user. We will also discuss how matplotlib developers manage and implement this variability.
In case the title confuses you, we will be talking about variability in the context of growing the library from an ancient version, 0.63.0 to the one available today, 3.4.0. We will be talking about a general overview, incompatibilities, feature models, variability management, and implementation.
Variability modeling
Main features
Software functionalities can vary on all three layers of running an application, namely on the hardware, operating system, of software layer. For the hardware and platform layer, the variability feature is rather simplistic: one of the main priorities of Matplotlib is that it should work on each combination of operating system and Python version. The software side of Matplotlib, however, has far more variability than hardware and platform layers. Many of these variabilities are related to visualization.
The data that serves as input and as the base of all visualizations can be input in a variety of formats. The default Python data types are accepted, as are other types of data frames such as those from NumPy or Pandas, which are better suitable for large collections of data. However, numerical data is not the only thing accepted as data by Matplotlib, as labels also play a huge role in visualizations. Besides regular strings, LaTeX notation is also accepted.
Depending on the input data, the user can choose from a variety of idioms to display the data. Among other types, users by default can choose from bar charts, line charts, scatterplots, histograms, and heatmaps. If the default idioms do not suffice, matplotlib allows easy use of external packages for extending functionality. The ability to manipulate images is also included within matplotlib.
Within the idioms, users can alter the appearance as they please, by changing fonts, and text sizes, DPI of the picture, and all channels including colors, shapes, angles, and placement. These settings can be set via the script which runs Matplotlib, or defaults can be changed using the configuration file.
At the end of this process, the user can choose which format to publish the visualization in (PNG, PDF, HTML). In certain formats, the user can choose to enable a variety of interactivity options, such as changing the data or visualization based on mouse clicks, drag and drop, sliders. Moreover, another variability option is the ability to add animations to the visualizations.
Incompatibilities
Through abstraction, matplotlib tries to make all operating systems be able to create the same visualizations. One of the ways they make sure that each behaves the same is by rigorous testing on all combinations of platforms and Python versions. Unfortunately, certain platform-specific issues can arise when changing the code. These bugs are reported on GitHub by developers, and can then be worked on to be resolved in future releases. There are only very few issues, and many have been resolved already.
For macOS, there have been problems switching displays with different DPI’s scales the figure, and fig.canvas.draw(), replacing fig.draw(fig.canvas.get_renderer()), does not yet work. Regarding Windows, this DPI scaling issue also occurs. There is no label available to assign issues specific to Linux.
Feature model
Here we see the feature model as discussed in the last sections. It is important to note that nearly all features are optional and most have an OR relation. This is again because there is a lot of freedom with using matplotlib. The only mandatory connections are dependencies of the program, it has to be used on python and of course, you need an operating system. But the model also visualises that you are free to choose the OS and Python version as it should work on most versions. It is also worth mentioning that not all features are shown here. Little tweaks are left out so that it would still be visibly pleasing. An example of this would be the features in the Publishing tree, other formats like .svg are also supported and it is possible to change the dpi of images.
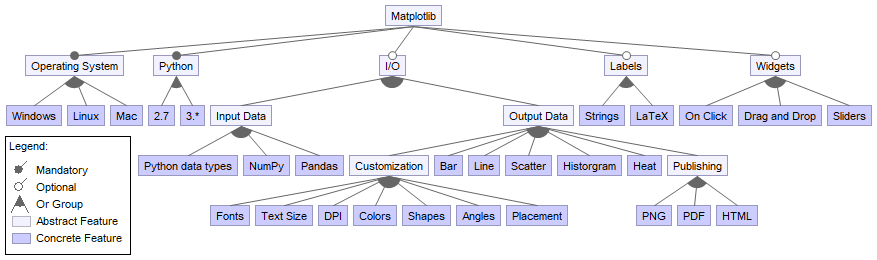
Figure: The feature model of matplotlib
Variability management
The main information for users to get started with matplotlib is documented in the installation guide, which covers instructions for each operating system. Most of the instructions to run Matplotlib are the same across the operating systems, but Matplotlib provides dedicated guides for matters that are OS-specific (e.g. setting environment variables).
A more elaborate developer’s installation guide iis provided as well. For cases where developers need to build older versions of matplotlib to fix a certain bug, a documentation of required dependencies for those versions are also available, as older versions of matplotlib requires older versions of Python and NumPy.
Every pull request to merge to the main branch has to go through the testing pipeline that Matplotlib has set that consists of various automated test tools. This pipeline includes automated testing of the combinations of all supported operating systems (macOS, Windows, Linux) and Python versions (>=3.7). However, as mentioned in the incompatibilities section, certain platform-specific issues caused by the code change can go undetected by these tests, and these are usually managed manually.
Variability implementation mechanism and binding time
Matplotlib has variability implemented on multiple verticals, from full customization over the resulting graphs to deployment on various platforms in a seamless way. Looking from a top-level perspective, the versioning system and the ability to be deployed on multiple platforms are the most noteworthy.
Versioning
Matplotlib has gone through a series of changes in the last few years, thus the versions have changed as well, ranging from 0.63.0on Sep 29, 2004, to 3.4.0 just a few days before writing this essay, on March 26, 2021. The developers manage this variable using the default features of GitHub, namely tagging the commits with a specific version number and setting new releases once a substantial number of new changes have been implemented. Also, they keep track of the new features by using milestones.
Platform variability
When it comes to platform variability, matplotlib can be used on any modern system, namely Linux, macOS, and Windows. They use azure pipelines 4 for this, deploying on 9 variations of Python Version and operating system at the time of writing this essay. This mechanism is also used on Pull Requests, any new change being required to compile on any deployment environment.
Variability implementation mechanisms and binding times
A full CI pass on a GitHub PR can indeed take up to half an hour and we assume that deploying on so many platforms takes at least this time. It is energy and time consuming, but it pays off when users across the whole operating system and python version spectrum can use the same visualization tool regardless of their device choices. In terms of future scalability, the number of relevant operating systems and Python versions increase linearly, so there is no need to be concerned about the inability to handle variability.
On the other side, the user variability that allows people to fully customize figures would not be limited by newly added functionalities, since matplotlib developers strive to build backward-compatible software.
Final notes
In our first 3 essays 1 2 3 we introduce matplotlib, as the main visualization library for Python users and we describe the motivation for creating and maintaining it and how easy it is to use. Then we go in-depth and explain the main architectural patterns, supporting those by a quality analysis, where we get a sense of how quality is enforced during matplotlib’s evolution. In this essay, we analyze how matplotlib developers handle variability and deployment on different platforms.
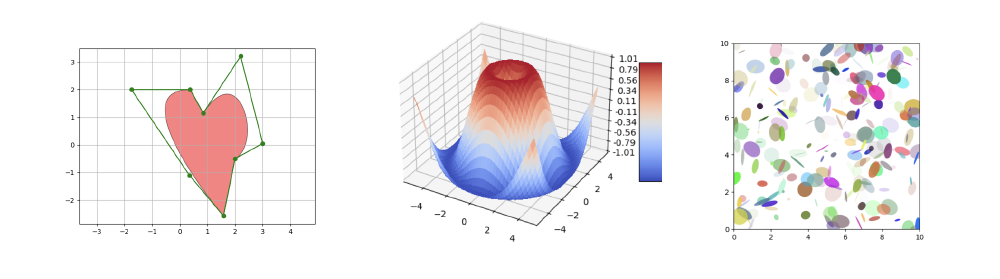
Figure: A last glimpse at what matplotlib can do
With this essay concluding the journey of exploring matplotlib, we can easily say that what happens behind the scenes of a simple and powerful API is complex and often not straightforward. Matplotlib is a good example of a scalable and well-organized architecture and development process, not too hard to confuse the user and not too shallow to be worthless exploring. Since no architecture is perfect, matplotlib has its tradeoffs when it comes to design decisions, offering insights on how scalable and customizable libraries are built. If you are looking for the next library to analyze and contribute to, matplotlib is a good tradeoff between a low entry margin and an insightful and well-built system, with lots of opportunities to learn from.